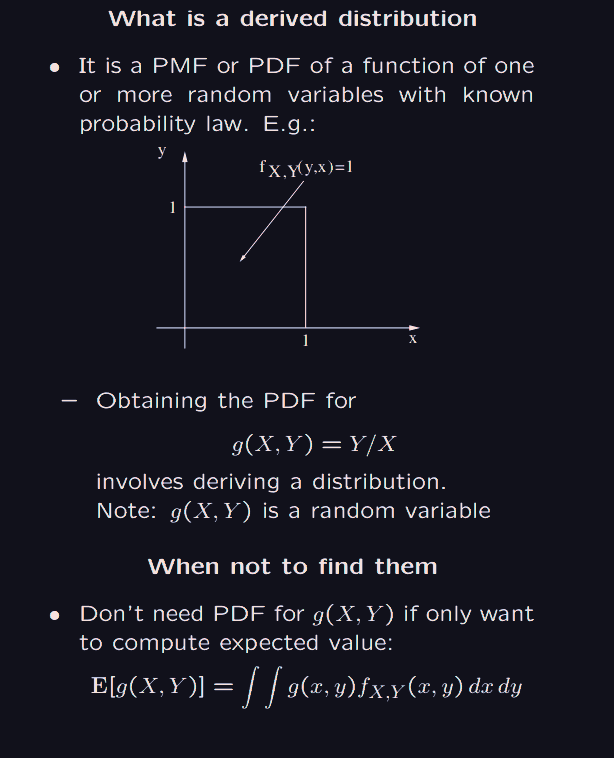
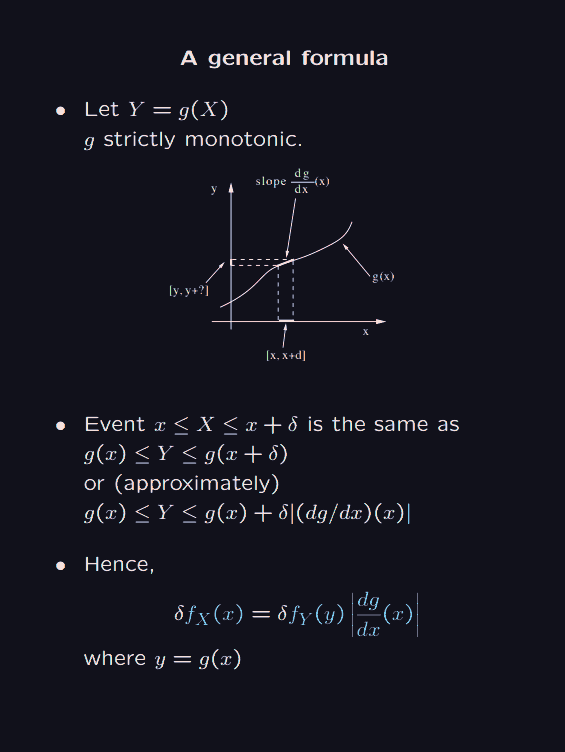
We want to combine some random variables and take some function on them, and then understand the distribution of the new random variable obtained.
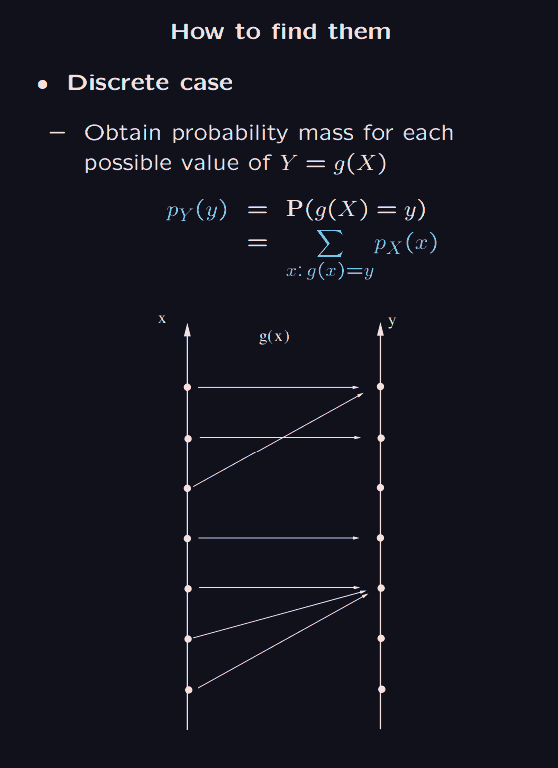
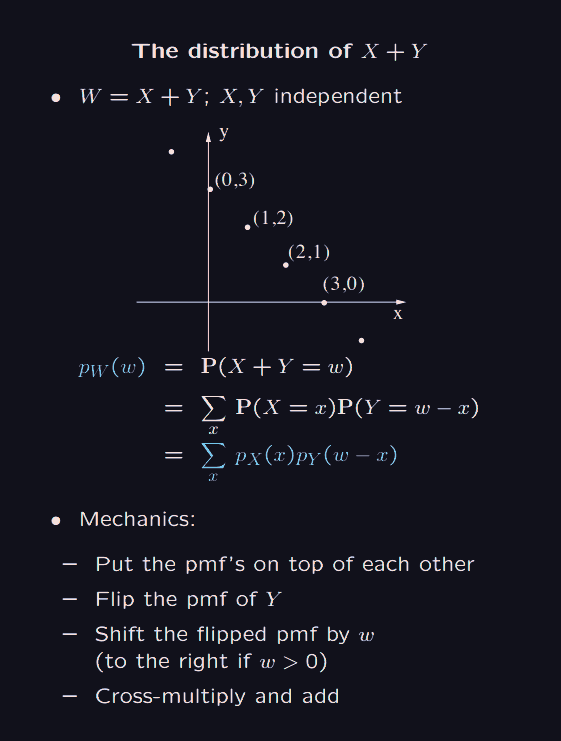
for the discreate case, the idea is simple enough. for each find out all such that . Then the probability of getting that , is the sum of the probabilities of getting each of those 's whose image under is .
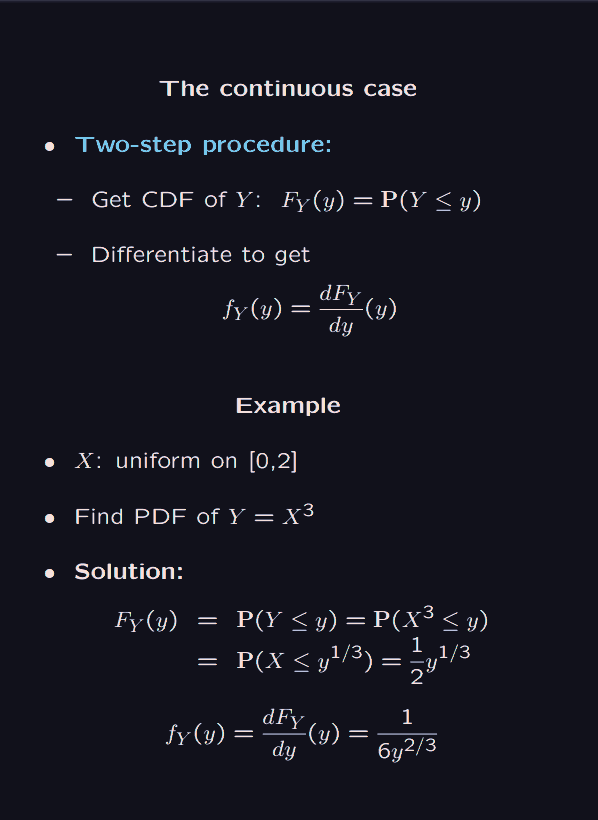
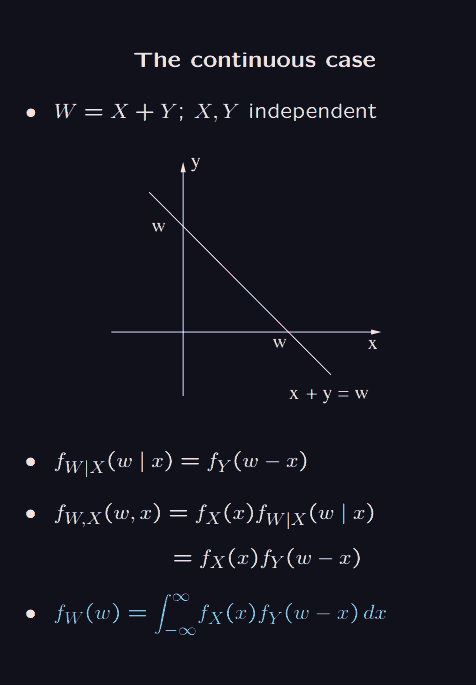
But in the continuous case, the probability of getting any single point is zero. So what we can do is given in the picture below:
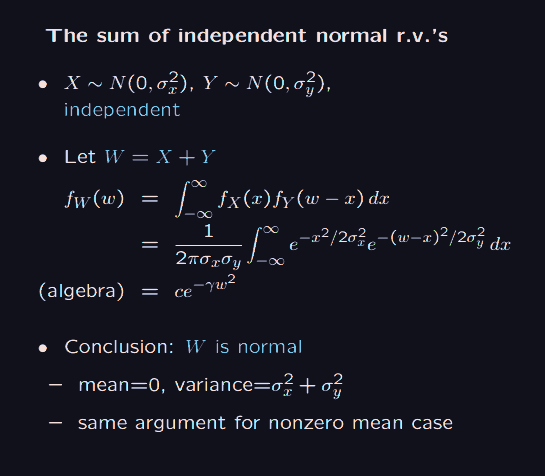
1d Convolution:
I mean the idea of finding the distribution of is more or less clear. Suppose we want , then we need to enumerate (or integrate) all pairs , but due to independence, . This operation is called convolution.
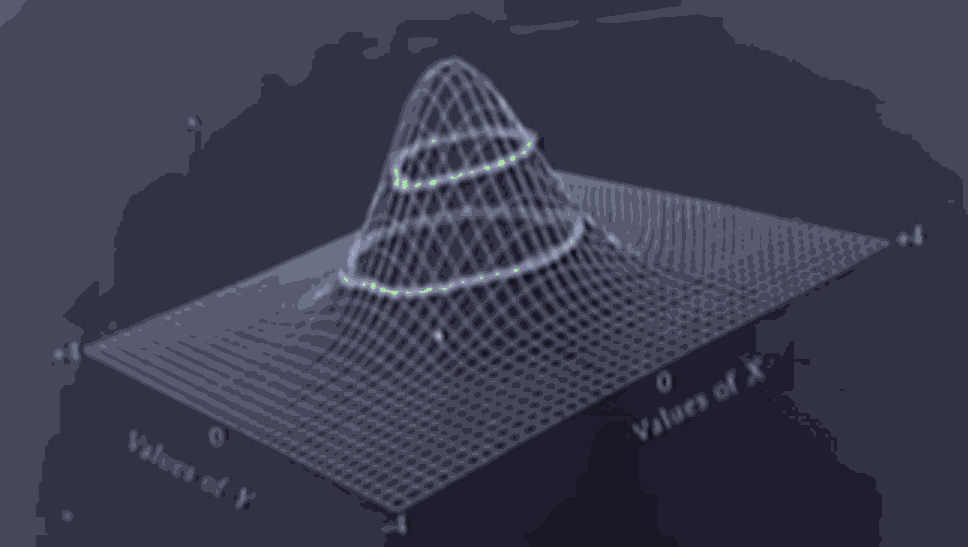
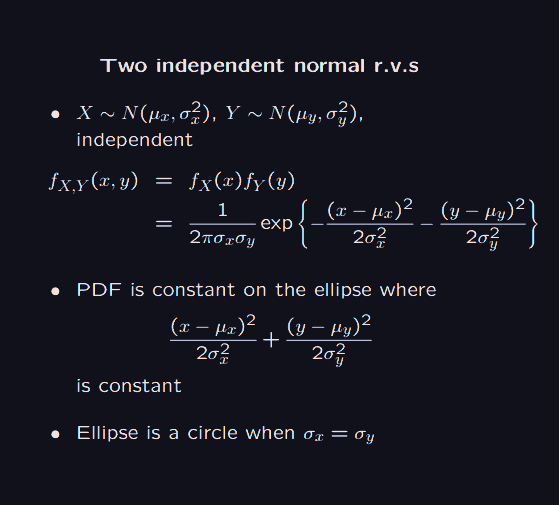
In the above picture the pink contours are where is constant at a value.
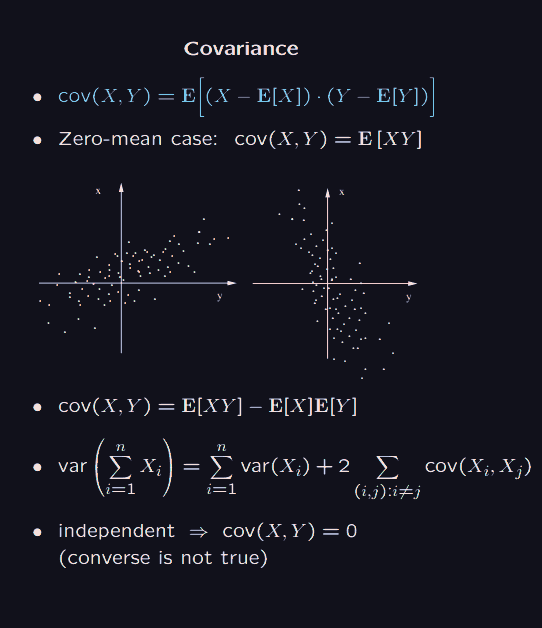
Let us talk about co-variance. Also the 2 in the formula is WRONG!!!
tells you how far (positive or negative) deviates from its mean, same for , taking their product sorta gives us the distribution which tells us: how often does get bigger than its mean along with getting bigger than it's mean? And how often does get smaller than it's mean along with getting smaller than its mean? and the expected value of this distribution (called covariance) if positive tells us that on average, get bigger and smaller than their respective means together. A negative covariance tells us that on average, when one gets bigger from its mean, the other gets smaller (this is just the nature of products)
Suppose are not independent.
Hence
let . .
Normally we write , but thinking about the pairs, we can also write .
Hence,
Therefore
Finally,
Even more finally, we can expand the rightmost term and get
To understand the formula intuitively, just thing about it like a pegion hole principle thing. When I sum the variances of each , I am overcounting the pairwise co-variance of them. I need to remove that.
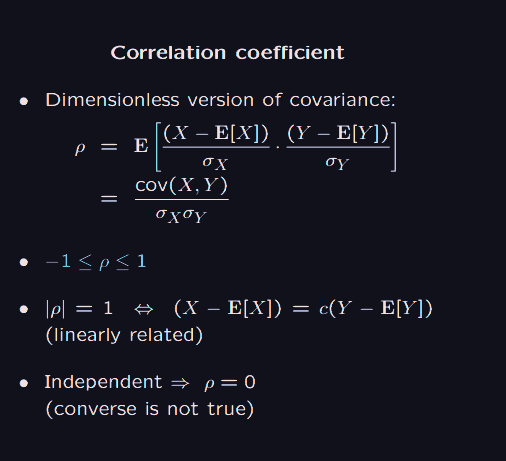
In general if are independent, . The converse is however not true.
the linearly related iff can be proved using the formular for covariance, and variance .